
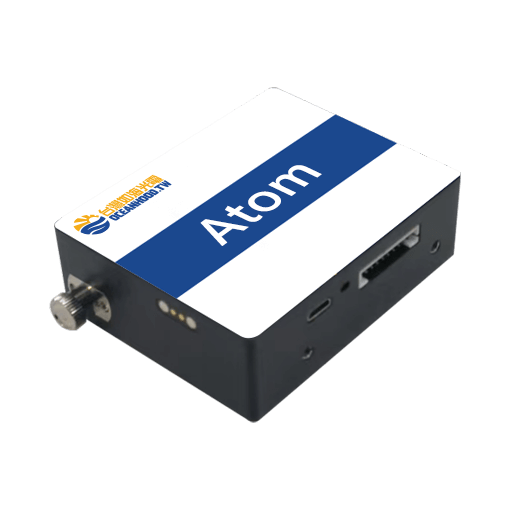
Atom micro spectrometer is a high cost-performance industrial-grade spectrometer. The instrument features compact size and light weight, making it convenient for transportation and portable use. The spectral range can be configured according to application requirements. The instrument can be applied to various industrial field measurements, including color measurement, absorbance measurement, flue gas measurement, scientific research and teaching, near-infrared absorption measurement (such as fruit sorting), and other applications.
-
Features
- Compatible with Oceanhood multi-core dense fiber bundles with positioning pins, fiber insertion/removal strength consistency ≤ 7%
- Strong ultraviolet spectral response
- CCD quantization background noise ≤ 30 RMS (minimum integration time)
- Equipped with USB and serial communication interfaces, a 10-PIN interaction interface, and dedicated DAC and ADC, enabling light source control, intensity adjustment, and power feedback for integrated light sources.
-
Specification
| Optical parameters | |
| Optical fiber interface | Key-SMA905 |
| Number of pixels | 1024 pixels |
| Stray light | ~0.5% |
| Wavelength temperature drift | ~0.1 pixel/℃ |
| Function parameters | |
| AD sampling | 16 bit |
| Data interface | USB2.0、RS232、TTL |
| Extended function interface | 10 PIN |
| Acquisition mode | Single, continuous, software trigger, synchronous external trigger, asynchronous reset external trigger |
| Detector integration time | 60 μs-65 s |
| Accuracy of external trigger delay | 10 µs |
| CCD read noise1 | ≤30 RMS |
| CCD dynamic range2 | 5000:1 |
| Signal-to-noise ratio | 300:1 |
| Response linearity3 | ≥98% |
| Others | |
| Weight | 200g |
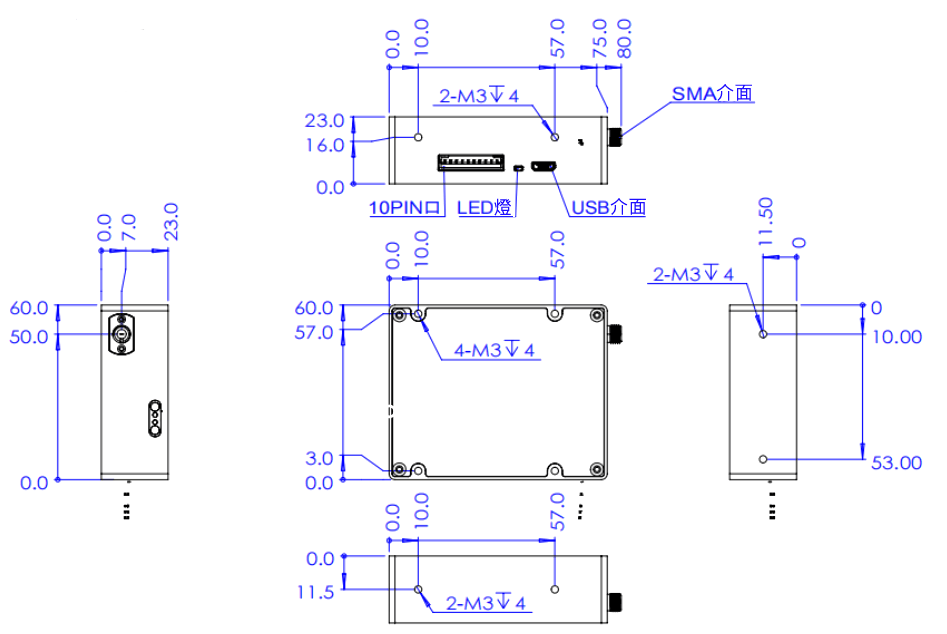
| Dimension | 75×60×23 mm |
| Operating temperature | 0℃~40℃ |
| Operating humidity | 20%-85% |
|
1.CCD Readout Noise: RMS value of the CCD readout noise measured at the minimum integration time.
2.CCD Dynamic Range: At minimum integration time, calculated as (Saturation value − dark noise baseline) / standard deviation of CCD readout noise. Evaluation method follows Oceanhood internal standards.
3. Response Linearity: Response nonlinearity before calibration. |
|
-
Products
| Model | Spectral Range | Resolution | |||
| Start | End |
10um
|
25 µm | 50 µm | |
| ATOM-200 - 405 | 200 | 405 | 1.0 | 1.2 | 1.5 |
| ATOM-370 - 790 | 370 | 790 | 1.5 | 1.8 | 2.0 |
| ATOM-200 - 1080 | 200 | 1080 | 3.5 | 4.0 | 4.5 |
► Spectral range and other parameters can be customized according to the actual application requirements.
► Spectral resolution may vary by approximately ±20% of the specified value.
-
Dimensional drawing
-
Applications
UV-Visible absorbance measurement
The Atom fiber optic spectrometer, with its compact size, efficient spectral detection capability, and convenient operation, is specifically designed for water quality analysis applications. It can rapidly and accurately detect multiple components and parameters in water, providing reliable data support for water quality monitoring, pollution warning, environmental research, and water treatment process control. It is an ideal analytical tool for water quality analysis.
Pollutant detection
- Heavy metal ion detection: Heavy metal ions such as lead (Pb), mercury (Hg), and cadmium (Cd) exhibit characteristic absorption peaks at specific wavelengths. By detecting their concentration, highly sensitive monitoring of heavy metal pollution in water bodies can be achieved.
- Organic pollutant detection: Common organic pollutants such as phenols and petroleum compounds can be analyzed through their UV-visible spectral absorption characteristics, assisting in water pollution assessment and remediation monitoring.
- Nutrient detection: Nutrient components such as ammonia nitrogen, nitrate nitrogen, nitrite nitrogen, and total phosphorus can be detected, supporting eutrophication monitoring and aquatic ecosystem restoration research.
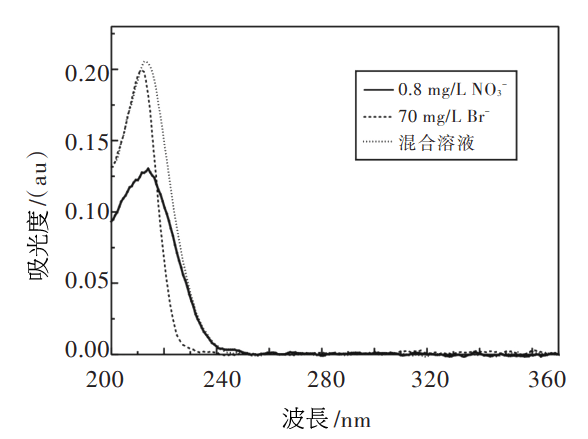
- pH measurement: By detecting spectral absorption characteristics within specific wavelength ranges, the acidity or alkalinity of water samples can be indirectly evaluated.
- Dissolved oxygen (DO) detection: Based on the relationship between fluorescence intensity changes and dissolved oxygen concentration, the spectrometer can measure DO concentration to support ecological monitoring and aeration process control.
- Turbidity analysis: Based on the proportional relationship between light scattering intensity and turbidity, suspended particle concentration in water can be effectively evaluated.
Color measurement
Principle: The basic principle of color measurement using a spectrometer is to determine color by measuring reflection, transmission, or absorption of light at different wavelengths. When light illuminates an object surface, part of the light is absorbed while the remaining portion is reflected or transmitted. The spectrometer decomposes the reflected or transmitted light into spectral components at different wavelengths and records the light intensity at each wavelength.
After processing, the spectral data can be mapped to standard color spaces (such as CIE1931, CIE1976, etc.), enabling accurate color measurement.Application fields
- Industrial production
In the printing industry, spectrometers are used to measure ink color.
In plastic manufacturing, spectrometers help control the color of both raw materials and finished products.
In plastic manufacturing, spectrometers help control the color of both raw materials and finished products.
- Textile industry
Spectrometers measure fabric dyeing results. Whether natural fibers (cotton, wool, silk) or synthetic fibers (polyester, nylon), spectrometers can accurately measure their color. Installing spectrometers on production lines enables rapid color inspection of dyed fabrics.

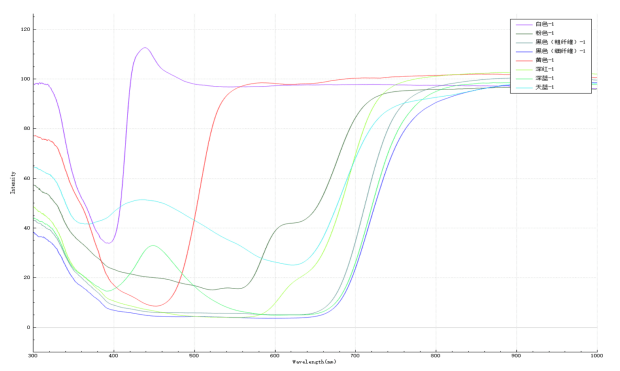
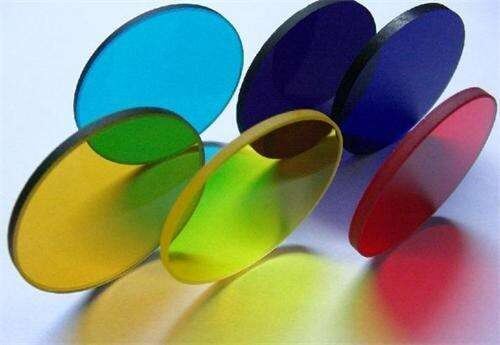
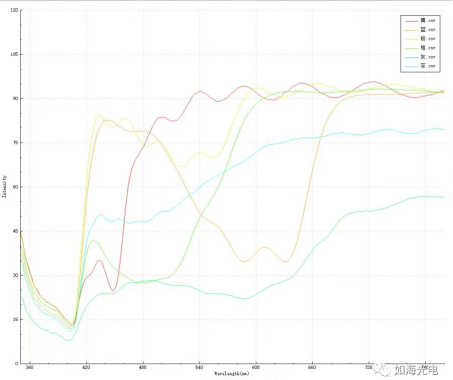
- Colored glass
Colored glass is produced by adding colorants during the melting process of ordinary glass and is widely used in interior decoration and architectural applications.
- Coating industry
Color is a key quality indicator for coatings. Spectrometers play an important role in coating development and manufacturing processes.
Educational applications
-
Physics teaching — principle demonstration
- Dispersion of light: Fiber spectrometers can visually demonstrate the dispersion of light. When polychromatic light is introduced into the instrument, students can clearly observe different wavelengths separated into spectra. Using diffraction gratings or prisms, students can observe both the wave and particle properties of light, enhancing their understanding of optical principles.
- Total internal reflection in optical fibers: The fiber transmission process can demonstrate total internal reflection. Teachers can guide students to observe fiber structures and explain reflection between the fiber core and cladding. By bending the fiber, students can observe changes in transmission efficiency and understand the conditions for total internal reflection.
- Fundamentals of spectral analysis: The spectrometer can measure spectra from various light sources. Teachers can demonstrate spectral components such as wavelength range, spectral line shape, and intensity distribution.
For example, measuring the spectrum of a sodium lamp allows students to observe its characteristic double yellow spectral lines, illustrating atomic spectral characteristics.
Fruit sorting
Principle: Spectrometers can accurately detect surface damage and internal composition changes in fruits through spectral features. Non-destructive detection ensures that fruit samples remain intact. This enables complete non-destructive analysis from fruit surface to internal composition, providing an efficient solution for intelligent agricultural sorting and quality control.
Advantages:
- Non-destructive rapid detection: Measurements are typically completed within milliseconds to seconds, enabling high-throughput online fruit sorting without damaging samples.
- Multi-parameter evaluation: A single spectral scan can evaluate multiple quality indicators simultaneously, such as sugar content, acidity, firmness, moisture, internal defects, and color.
- Ease of integration: The compact size and standard communication interfaces allow easy integration into robotic fruit sorting systems, conveyor systems, or portable devices.
- High accuracy and consistency: Compared with manual sorting, spectroscopic methods combined with chemometric models provide more objective and consistent results.
- Flexibility and customization: Spectrometers offer multiple options for wavelength range, resolution, and slit size, enabling optimization for different fruit varieties and quality parameters.
- Promoting standardization and branding: Precise quality grading helps achieve standardized production and improved brand competitiveness.
Plant Growth Status Monitoring
Plant status monitoring technology evaluates plant physiological status, biochemical composition, and health condition by analyzing the absorption characteristics of leaves at different wavelengths. Leaf chemical components such as pigments, water, proteins, cellulose, and lignin selectively absorb electromagnetic radiation at specific wavelengths.
- Chlorophyll (Chlorophyll a & b): Chlorophyll strongly absorbs blue light (400–500 nm) and red light (600–700 nm) while reflecting green light (500–600 nm), giving leaves their green appearance.
Changes in chlorophyll concentration affect the red-edge region (680–760 nm), indicating plant health and photosynthetic activity.
- Carotenoids: Carotenoids absorb blue-violet light (400–530 nm) and appear more visible when chlorophyll degrades during plant stress or aging.
- Water: Water exhibits absorption bands in the near-infrared region near 970 nm, 1200 nm, 1450 nm, and 1940 nm, allowing evaluation of plant water status.
- Nitrogen: Nitrogen indirectly affects spectral characteristics through its influence on chlorophyll and protein content. Absorption features related to N-H and C-H bond vibrations can be used to estimate nitrogen levels.
- Other biochemical components: Proteins, cellulose, lignin, and starch exhibit absorption features in the near-infrared and shortwave infrared regions, related to plant structure and maturity.
- Disease Stress: Biotic stress caused by pests and diseases typically alters the physiological and biochemical parameters of leaves, such as pigment degradation, water imbalance, and cellular structure damage. These changes are reflected in the spectral reflectance or absorption curves of the leaves. Therefore, spectroscopic techniques can be used for early disease detection and monitoring. For example, variations in pigment and moisture content in infected regions result in spectral characteristics that differ from those of healthy areas.
Conclusion: By analyzing the characteristic absorption peaks in leaf spectra, key plant physiological indicators—such as chlorophyll content and stress status—can be determined. Furthermore, by measuring leaf absorbance, reflectance, or transmittance within specific wavelength ranges, and combining these data with vegetation indices (e.g., NDVI, PRI, EVI) and chemometric models, both quantitative and qualitative evaluations of physiological and biochemical parameters can be achieved. This approach provides critical technical support for precision agriculture, plant stress monitoring, and ecological research.