
DQPro is a deeply TE-cooled fiber optic spectrometer with a cooling temperature down to -25 ℃. It features a compact structural design and a configurable spectral range. The spectrometer offers high resolution, reaching up to 0.1 nm, and low stray light of approximately ~0.5%. With excellent spectral response stability and reproducibility, it is well suited for a wide range of industrial on-site measurements, including laser measurement, plasma emission spectroscopy, color measurement, absorbance measurement, and Raman measurement.
-
Features
- Cooling temperature down to -25 ℃, featuring extremely low readout dark noise and excellent stability.
- Compatible with multi-core densely packed fiber bundles, with fiber insertion/extraction strength consistency ≤7%.
- Wide dynamic range, high signal-to-noise ratio, and superior stability.
- CCD quantization background noise ≤3 RMS (at minimum integration time). Equipped with multiple communication interfaces such as USB and serial port, along with a 24-pin interactive interface. Built-in dedicated DAC and ADC enable light source activation, intensity control, and power feedback.
-
Specification
| Optical parameters | |
| Optical fiber interface | Key-SMA905 |
| Number of pixels1 | 1024×58 pixels |
| Stray light | ~0.5% |
| Consistency of optical fiber insertion and removal | ≤7% |
| Function parameters | |
| AD sampling | 16bit |
| Data interface | USB2.0、RS232 |
| Extended function interface | 24PIN |
| Acquisition mode | Single, continuous, software trigger, synchronous external trigger, asynchronous reset external trigger |
| Detector integration time | 8ms-30min |
| CCD read noise2 | ≤3 |
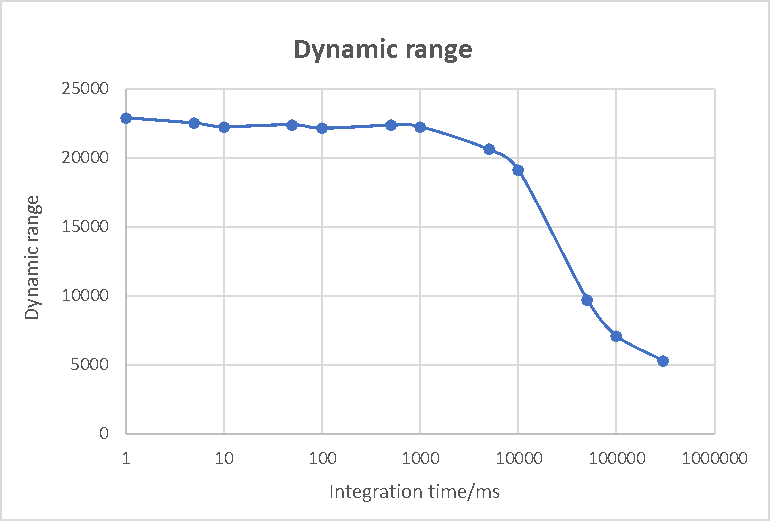
| CCD dynamic range3 | 22000:1 |
| CCD dynamic range (full signal)4 | 40000:1 |
| Signal-to-noise ratio5 | 1000:1 |
| Response linearity6 | ≥98% |
| Others | |
| Weight | ≈1.24kg |
| Dimension | 181×111.5×55mm |
| Operating temperature | 0℃~40℃ |
| Working humidity | 20%-85% |
| 1. Pixel configuration can be customized according to customer requirements as 2048×128 or 2048×256 pixels. 2. CCD readout noise: measured as the root mean square (RMS) value at the minimum integration time. 3. CCD dynamic range: under minimum integration time conditions, calculated as (saturation value – dark noise baseline) / standard deviation of CCD readout noise; evaluation method follows Oceanhood Taiwan’s standard. 4. Dynamic range (full signal) is evaluated according to the CCD manufacturer’s specifications and industry-recognized standards. 5. Signal-to-noise ratio (SNR) evaluation and calculation are performed in accordance with Oceanhood Taiwan’s standard rating method. 6. Response nonlinearity is measured prior to calibration. |
|
-
Products
Model Cooling
temperatureSpectral Range Spectral resolution °CStart End 10um25um50um100umDQPro-200-970-252009701.31.802.2-DQPro-350-1050-253501050-2.2DQPro-795-1030-2579510300.50-DQPro-790-930-257909300.30DQPro-535-625-25535625-0.32--
►The specifications listed above are standard. Wavelength range and resolution can be customized to meet customer requirements.
-
Dimensional drawing

-
Testing Spectrums
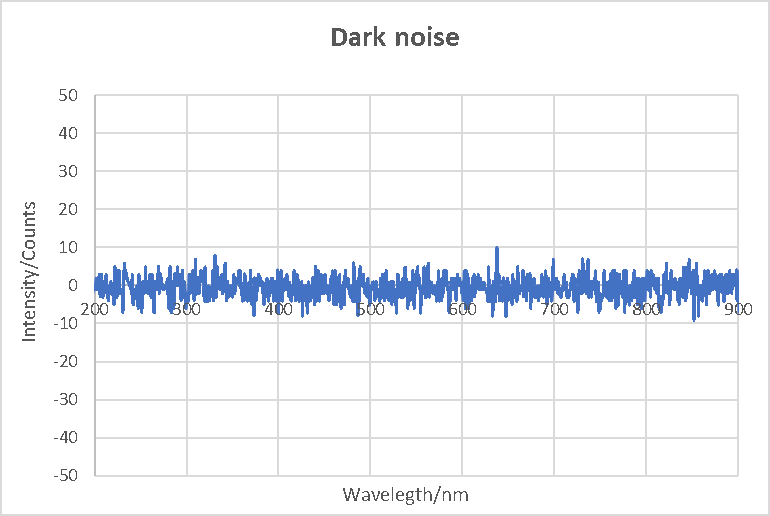
Dark noise (Integration time:10ms)
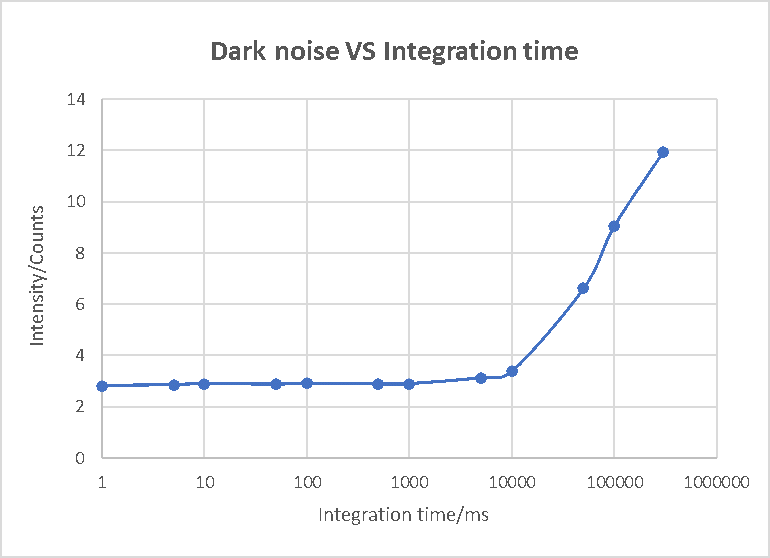
Dark noise VS Integration time
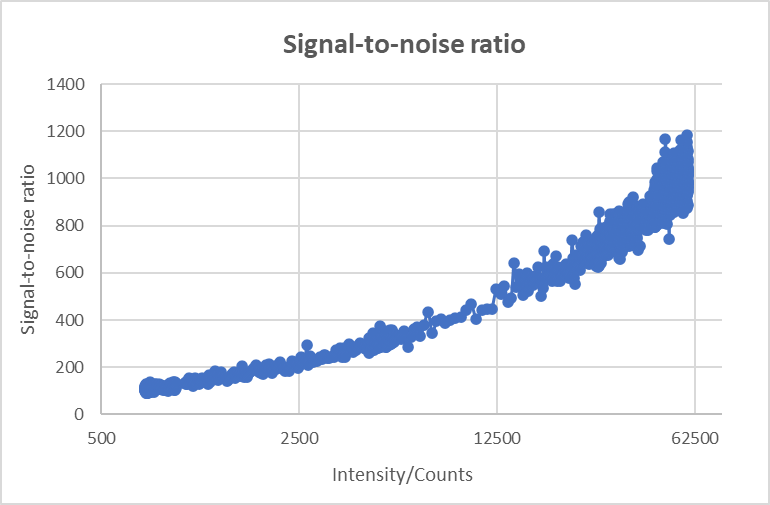
Signal-to-noise ratio (Integration time:10ms, active)
Dynamic range
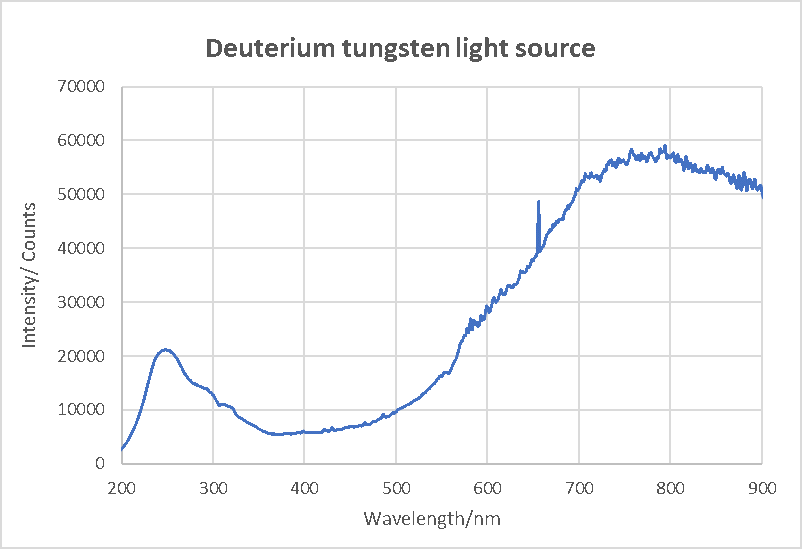
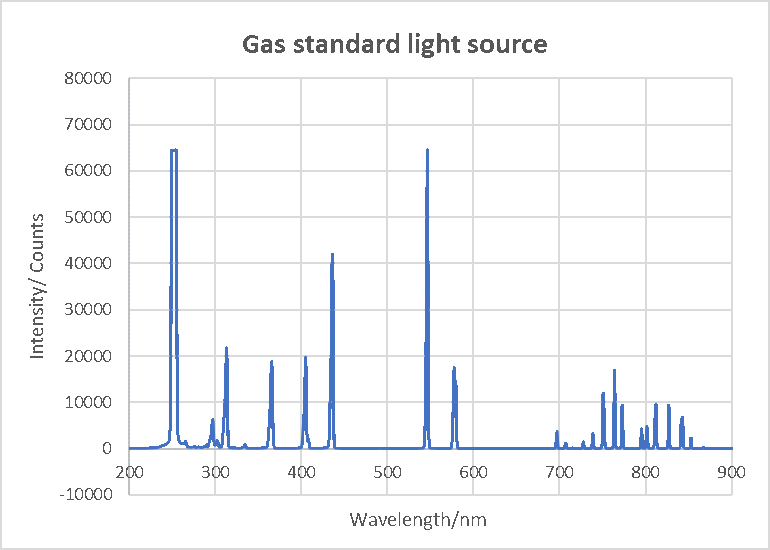
Standard light source (200-900nm)
Standard light source (200-900nm)
Deuterium tungsten light source (200-900nm)